From ecology to economy - unlock the full potential of your enterprise
The Science
of Energy Efficiency
ANSELM is an innovative systematic scientific method for profitable decarbonization of heat-intensive industries. We maximize energy efficiency and reduce emissions the fastest and most economically viable way possible, without compromising on production capacity
ANSELM Software Ecosystem


Save the world's resources for future generations and minimize impact on the planet by utilizing 100% of the industry's potential. Worldwide
The global
estimated potential for reducing the consumption
of fuel and energy resources by increasing energy efficiency
of refineries ranges from
20.5% to 34.5%
estimated potential for reducing the consumption
of fuel and energy resources by increasing energy efficiency
of refineries ranges from
20.5% to 34.5%
Annual estimated potential for increasing the profitability of the oil refining industry using ANSELM Energy Efficiency Evaluation (ЕЕЕ)

$8.3 billion
USA

$5.5 billion
China

$2.5 billion
India

$1.5 billion
Saudi Arabia

$1.5 billion
South Korea

$1.4 billion
Japan

$0.9 billion
Brazil

$0.9 billion
Canada

$0.8 billion
Germany

$0.8 billion
Iran

$0.7 billion
Italy

$40 billion
Worldwide
ANSELM calculates the energy efficiency potential of the entire facility, addressing the key questions:
By how much (%) could the efficiency of each process unit be improved?
If improving the efficiency requires investment, would such projects be economically viable?
Are there any other units, where similar investment could yield a larger economic effect?
Lack of such key information leads to mistakes in strategic planning which cost many millions of dollars in long term.
ANSELM answers the main questions top management and shareholders have:
where to invest, how much, and what the economic effect will be
MISSION
The cost
of decarbonizing
the US refining industry
is expected to reach
of decarbonizing
the US refining industry
is expected to reach
by 2030
2023 Annual Energy Outlook
by US Energy Information Administration
by US Energy Information Administration

Refineries in the
US can cost-effectively
improve energy efficiency
and reduce CO2 emissions by at least 20%
US can cost-effectively
improve energy efficiency
and reduce CO2 emissions by at least 20%
World Refinery Research
by HSB Solomon
Associates, LLC
by HSB Solomon
Associates, LLC
US DOE/EE-2635 Industrial Decarbonization Roadmap
by US Department
of Energy
by US Department
of Energy
Akin to Carl Linnaeus, who classified the flora and fauna of our planet, or Dmitry Mendeleev, who described the fundamental relationships between chemical elements, our international team of scientists created ANSELM − a unique system of indicators and algorithms to identify and prioritize all ways to improve the energy efficiency and reduce emissions of any facility operating with heat exchange cycles − with highest economic viability.
With over 120 years of combined industrial experience and scientific research in energy efficiency optimization in the context of refining, our team is confident that no other approach used worldwide will match the output of ANSELM.
This is a breakthrough in improving energy efficiency and a reliable way to maximize your return from ESG investments.
This is a breakthrough in improving energy efficiency and a reliable way to maximize your return from ESG investments.
Roman Chibisov
Chief Technology Officer
VP Software Development
Chief Technology Officer
VP Software Development

Prof. Leonid Ulyev
Senior Research Fellow
Heat Integration Expert
Senior Research Fellow
Heat Integration Expert
Nik Chekshin
Founder,
Chief Executive Officer
Founder,
Chief Executive Officer

Max Kanischev
Chief Scientific Officer
VP Refining Excellence
Chief Scientific Officer
VP Refining Excellence


LEADERSHIP TEAM
3. Pyrolysis, European plant
CASES
RECENT Anselm`s OPTIMIZATION REFERENCES
Refinery production capacity: 140 000 barrels per day
Project description: Reconstruction of the heat exchange system made it possible to reduce the power consumed by the process of primary oil refining by 44.75 Gcal/h or 392 010 Gcal/year = 39 201 MTOE (metric ton of oil equivalent)/year
Energy consumption prior to project implementation:
957 380 Gcal/year = 95 738 MTOE (metric ton of oil equivalent)/year
Energy consumption after project implementation:
565 370 Gcal/year = 56 537 MTOE/year

Refinery production capacity: 120 000 barrels per day
Project description: Reconstruction of the heat exchange system made it possible to reduce the power consumed by the process of primary oil refining by 17.53 Gcal/h or 153 564 Gcal/year = 15 356 MTOE (metric ton of oil equivalent)/year
The integration of three new heat exchangers made it possible
to abandon the use of a furnace at the gasoline stabilization unit
Energy consumption prior to project implementation:
1 153 199 Gcal/year = 115 320 MTOE (metric ton of oil equivalent)/year
Energy consumption after project implementation:
999 635 Gcal/year = 99 964 MTOE/year

Plant production capacity:
◆ ethylene 1 500 thousand tons per year
◆ propylene 525 thousand tons per year
Project description: Сompressed ethylene vapors are fed into a new heat exchanger to heat the column bottom, ethylene vapors are cooled and enter the water cooler

1. CDU/VDU, European refinery
2. CDU/VDU, European refinery
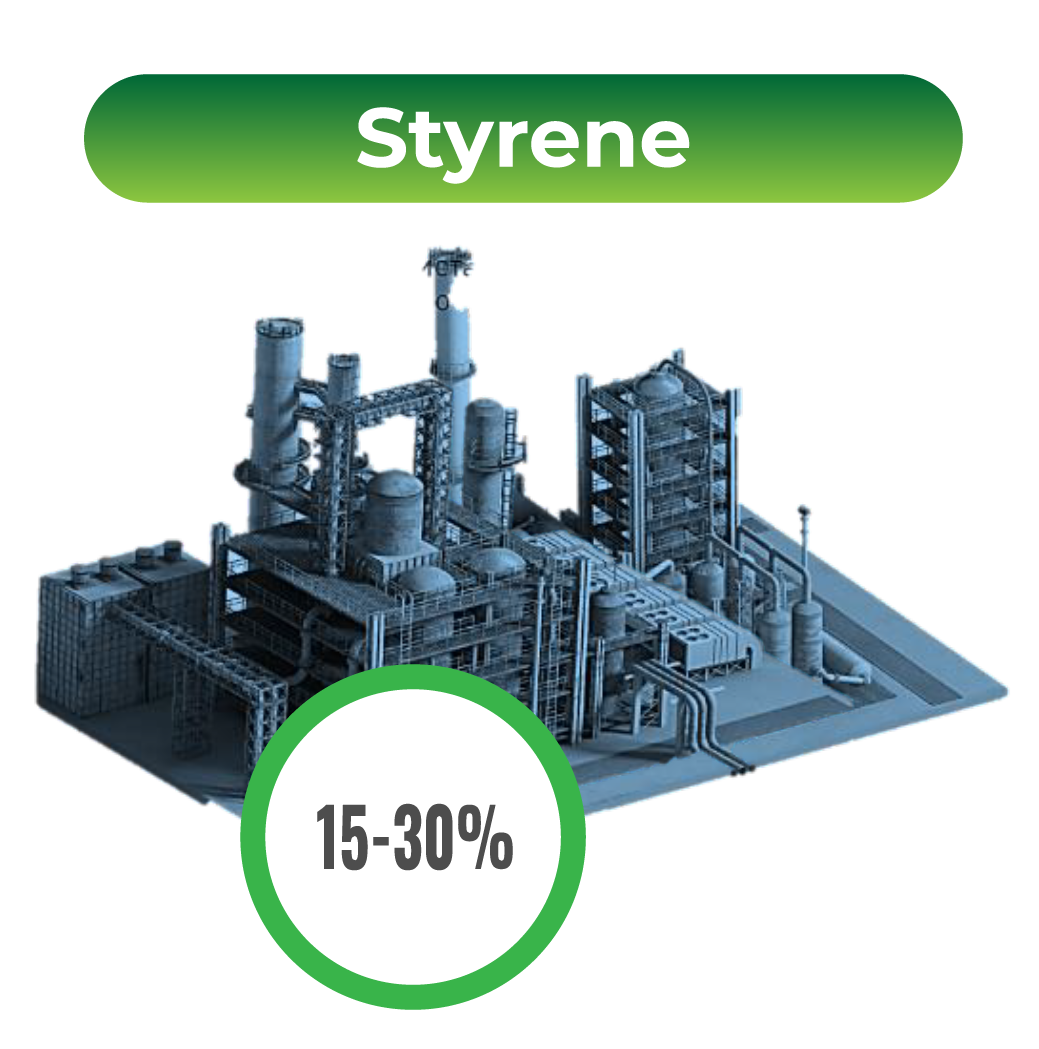
Average reduction in energy consumption after ANSELM optimization by unit type*
* Data average from real cases, ANSELM Inc
Energy savings: 392 010 Gcal/year = 39 201 MTOE/year
Emissions reduction: 124 000 tons of CO2 equivalent per annum
Emissions reduction: 124 000 tons of CO2 equivalent per annum
Energy savings: 153 564 Gcal/year = 15 356 MTOE/year
Emissions reduction: 48 575 tons of CO2 equivalent per annum
Emissions reduction: 48 575 tons of CO2 equivalent per annum
Reduction in electricity consumption: 1 million kWh/year
Reduction in thermal energy consumption: 55 000 Gcal/year
Emissions reduction: 15 000 tons of CO2 equivalent per annum
Reduction in thermal energy consumption: 55 000 Gcal/year
Emissions reduction: 15 000 tons of CO2 equivalent per annum


Our efficiency optimization cases portfolio spans over 100 projects designed and implemented for the largest oil refining and petrochemical companies of the Eastern hemisphere.
From new and modern to complex and deep processing, our expertise covers the full spectrum of facilities.
We have consistently delivered unmatched results and high profitability regardless of configuration, age, or location.
From new and modern to complex and deep processing, our expertise covers the full spectrum of facilities.
We have consistently delivered unmatched results and high profitability regardless of configuration, age, or location.
Please contact us to learn more about our other cases and references of downstream optimization.
Benefits and Features
features

For each compound device we identify breaks between current and potential minimal consumption. Break divided for 3 types of resources or area of optimization.
Breaks Diagram show difference in energy or money measurement units.
In this case we see that break for this compound device created by inefficient work of ovens heat exchange system
Input of electric equipment can be neglected and concentration only on 2 areas of equipment.
Breaks Diagram show difference in energy or money measurement units.
In this case we see that break for this compound device created by inefficient work of ovens heat exchange system
Input of electric equipment can be neglected and concentration only on 2 areas of equipment.
Energy break diagram for a primary processing unit*
* Real Case Data, European refinery, ANSELM Inc
This approach leads to reduced implementation time to achieve maximum efficiency
For the plants included in the survey, a General map of energy efficiency projects is formed*
The potential for all units is broken down into a project map, according to the gap chart.
In the presented chart, the size of the rectangle characterizes the size of the effect from the
implementation of a particular unit project. Several projects in different areas of optimization can
be proposed for one unit. As we can see from the chart, only 11 projects from 63 (15% of the total)
cover 50% of the energy saving potential at the refinery.
As a result, the choice comes from the list of ready-made projects.
* Real case data, European refinery, ANSELM Inc.
The set and number of projects may differ for other refineries.
The set and number of projects may differ for other refineries.

Financial efficiency for each project
- For each direction of efficiency improvement ANSELM automatically calculates economic indicators: IRR, NPV, DPP, PI.
- This allows you to immediately cut off projects, the implementation of which is impractical, and focus on the ones with maximum profitability.
- The calculation for each unit is performed taking into account the schedule of its repairs, the region, the cost of energy resources, etc.
- As a result, an economically justified map of energy efficiency projects is produced.
ANSELM ZERO: enterprise
income from $140 to $200
reducing a ton of CO2
emissions
income from $140 to $200
reducing a ton of CO2
emissions
The result: profitable decarbonization

Other technologies:
enterprise loses up to $150
capturing a ton of CO2
enterprise loses up to $150
capturing a ton of CO2

By reducing fuel and energy consumption with ANSELM, businesses are taking the first step towards achieving carbon neutrality.
Maximizing energy efficiency is the way to perform industrial decarbonization while gaining significant profits.
Decarbonization is more than ecology.
More than economy.
Decarbonization is the future for all of us
Maximizing energy efficiency is the way to perform industrial decarbonization while gaining significant profits.
Decarbonization is more than ecology.
More than economy.
Decarbonization is the future for all of us
benefits
Sustainability: reducing the carbon footprint and improving energy efficiency directly affects the company's performance and ESG rating, paving the path of sustainable development and net-zero

Decarbonization: ANSELM reduces Scope 1 CO2 emissions by an average of 30%, making progress towards net-zero and lowering the emissions that needs to be sequestered
Insight: the "blind zone" around energy efficiency projects is excluded

Ease: does not require an expensive instrumental survey of the units for decision-making

Convenience: analysis can be performed remotely and in real time without any operation disruption, all our projects are developed on a turnkey basis

Speed: full primary examination completed in 1-3 months

Completeness: decision-making is carried out on the full range of activities and directions, improving investment planning by directing funds to most profitable projects

Assurance: all our energy efficiency projects bring guaranteed profits and are equally applicable on modern and outdated equipment

Structure: a project map structured according to energy, emissions, and economic criteria is formed

Objectivity: our calculations use verified digital data on process flows and equipment parameters, exclude human error, and fully reflect the actual situation

Reliability: all our reduction of energy consumption and emissions projects are verifiable and backed by scientific research and economic justification

Support: we provide full support, including assistance with obtaining initial data for calculations, digitizing documentation, providing a list of reliable contractors and equipment suppliers for the implementation of projects

Benchmarking: relative indicators of energy efficiency potential allow to compare across full range of scale, from single equipment to units and assets of the company as a whole

Documentation: Together with SAP, we provide a full range of services to ensure companies become and remain leaders in reducing their carbon footprint:
- Development and implementation of sustainable development standards, a comprehensive strategy in the field of ecology and climate change;
- Calculation of the carbon footprint of products;
- Development of a roadmap for achieving carbon neutrality of the company and its products;
- Calculation of emission standards according to the GHG protocol;
- Verification of results


ANSELM Software Ecosystem
Your digital guide to technical processes
for making the most effective decisions
The ultimate profitable approach to reducing CO2 emissions and improving energy efficiency
Your digital guide to technical processes
for making the most effective decisions
The ultimate profitable approach to reducing CO2 emissions and improving energy efficiency
Contact us:
Take the first step to reduce energy
consumption by 30%
Produce with highest efficiency
Take the first step to reducing
emissions by 30%
Decarbonize with highest profits


Steps Of Decision-Making
- This diagram illustrates how mistakes can be made by management in making a decision without having the full picture.
- Accounting for the installation potential and economic parameters of projects completely changes the picture of project priority.
- ANSELM develops projects with practicality in mind, accounting for the economic viability of implementation.

WHAT WE OFFER
Increased Profits
Improved Energy
Efficiency
Efficiency
Complete Picture
You will be presented with all possible strategies to improve energy efficiency and methods to implement them.
Our projects are tailored to your specific needs, investment strategy, and equipment.
Our projects are tailored to your specific needs, investment strategy, and equipment.
All measures we recommend are economically justified and selected to enhance profitability.
Most of them have shown a 100% + payback within the first year of implementation
Most of them have shown a 100% + payback within the first year of implementation
Implementation cases have demonstrated an average of 30% efficiency improvement


ANSELM Report stages
2
Partitioning the calculated unrealized potential into its sources
Common sources include:
Furnaces
Heat exchange systems
Electric equipment
Technological units
Furnaces
Heat exchange systems
Electric equipment
Technological units
3
Constructing a project map for efficiency improvement
Projects are sorted according to the effect achieved and presented as a graphically intuitive map
4
Identifying priority projects
We take the crop of the highest efficiency potential projects out of the project map. Most often, top 20% of all projects accounts for 80% of the full technologically achievable potential of the facility
1
Determination of the energy saving potential for all units
Calculated on two levels:
1) Technologically achievable, based on the actual cofiguration and current state of the unit;
2) Target, economically viable leve
1) Technologically achievable, based on the actual cofiguration and current state of the unit;
2) Target, economically viable leve
5
Budget calculation
For the projects selected at stage 4, implementation costs are determined based on standard rates, including capital costs, design, construction and installation works, and commissioning
6
Chosen based on the company's planning prerequisites, according to the value of economic indicators: IRR, NPV, DPP, PI, ranked by efficiency
Selection of target projects
7
Based on the ranked list of projects from stage 6, specific strategic goals are set to improve efficiency, with a specific effect and deadline, and an implementation roadmap is formed
Setting the goals
How it works
We process it and reach out to you with a report on the results
Historic operation and processing data collected by ANSELM
Instrumental examination on site is not required
WHAT YOU GET
A comprehensive roadmap for improving energy efficiency and reducing atmospheric emissions of your enterprise, including the analysis of capital costs, concrete measurable goals, and estimated profits
Total time needed: 3 months
Step 2
Step 1


Our partners
A world leader in process furnaces for refining, petrochemicals, syngas and hydrogen markets
A world leader in energy and automation digital solutions for efficiency and sustainability


ANSELM is proud
to be a member of:
to be a member of:
Our research
is supported by:
is supported by:

Contact us:
ANSELM Inc. | 2801 B St, #3018
San Diego, CA 92102
+1 (858) 241-1975
San Diego, CA 92102
+1 (858) 241-1975
© 2024 ANSELM Inc. All rights reserved


